For years, Biostat Company has been preparing statistical reports from various fields. In our team, we have a group of experts with clinical and academic experience who participate in creating analyses tailored to the needs of each client.
Reports prepared by Biostat are characterized not only by the accuracy of the analysis but also by a structure compliant with statistical standards, presenting results in an accessible manner, and aesthetics.
An additional advantage is the ability to prepare reports in English. To showcase our work, we have prepared a sample statistical report regarding lung cancer treatment.
Below is a brief description, while the full report can be found at the provided link:
 Medical Report
Socio-Economic Report
Medical Report
Socio-Economic Report

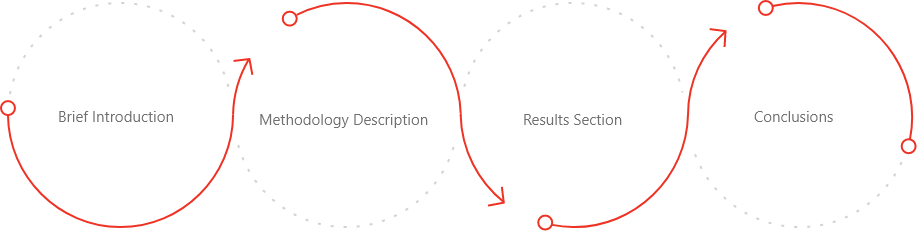
Brief Introduction
Allows even an uninformed reader to familiarize themselves with the research topic.

The presented statistical report concerns the comparison of the effectiveness of Therapy 1, which involved the administration of Drug 1 and Drug 2 in combination with chemotherapy, and Therapy 2, which is standard chemotherapy.
Methodology Description
This section aims to describe the selected statistical methods in the study. This allows for a better understanding of the applied solutions and can also be presented, for example, in scientific publications or grant proposals.
For example, the following statistical tests were used:
 Mann-Whitney U test
Chi-Square test
Kruskal-Wallis test
Fisher's test
Mann-Whitney U test
Chi-Square test
Kruskal-Wallis test
Fisher's test
The Mann-Whitney U test is a non-parametric test that checks for differences in distribution between two groups.
The Kruskal-Wallis test is also a non-parametric test used to compare the distribution of a variable among multiple groups.
To examine the relationship between categorical variables, the chi-square test or Fisher's test was used.

Results
This section presents the results of the conducted statistical analyses. It is divided into paragraphs to facilitate navigation through the document.
Baseline Characteristics
Simply put, this is a characterization of the study population. It provides basic information about the group, such as gender distribution, age, disease stage described by the group's size or percentage, as well as basic statistics.
The study involved 200 patients at various stages of lung cancer. Patients were divided into two equal-sized groups based on the treatment arm. The statistical analysis began with the baseline characteristics of parameters for the entire study group.
For continuous data, descriptive statistics were used to describe the characteristics of the study group: mean, median, standard deviation (SD), as well as the first and third quartiles (IQR) and range.
For categorical data, the frequency distribution of individual responses was presented, using the counts of each category and their distribution expressed as percentages.
| Variable | Parameter | Total (N=200) |
| Gender | Male Female |
46,5% (N=93) 53,5% (N=107) |
| Age | N Mean (SD) Median (IQR) Range |
200 56,14 (13,84) 59 (40 - 69) 27 - 77 |
| Age Relative to 65 Years | More than 65 years Not more than 65 years |
46,5% (N=93) 53,5% (N=107) |
| Disease Stage | 1 2 3 4 |
25,5% (N=51) 23,5% (N=47) 24% (N=48) 27% (N=54) |
| Tobacco Smoking | Former Smoker Current Smoker Non-Smoker |
32,5% (N=65) 34% (N=68) 33,5% (N=67) |
| Death | Tak | 18% (N=36) |
| Time from Diagnosis to Treatment Completion /Death | No N Mean (SD) Median (IQR) Range |
82% (N=164) 200 240,48 (43,54) 239 (205,75 - 275) 152 - 326 |
| Treatment Arm | Therapy 1 Therapy 2 |
50% (N=100) 50% (N=100) |
Table 1. General Descriptive Characteristics
Generated using R version 4.1.3
The most common comorbid conditions were also considered, such as hypertension, diabetes, obesity, chronic obstructive pulmonary disease, atherosclerosis, coronary heart disease, gallbladder stones, kidney stones, and peptic ulcer.
Before commencing the study, patients underwent basic blood parameter tests. Adverse events were examined for their frequency of occurrence, including neutropenia, anemia, diarrhea, and rash.
Analysis by Study Groups
The purpose is to present the main analyses related to the primary and secondary objectives of the study, stratified by selected groups such as gender, age, type of therapy or medication used.
| Variable | Parameter | Therapy 1 (N=100) | Therapy 2 (N=100) | test | p-value |
| Płeć | Male Female |
50% (N=50) 50% (N=50) |
43% (N=43) 57% (N=57) |
chi-square | 0,395 |
| Age | N Mean (SD) Median (IQR) Range |
100 56,44 (13,44) 59 (40 - 69) 34 - 77 |
100 55,84 (14,29) 59 (40 - 67,5) 27 - 77 |
U Mann-Whitney | 0,468 |
| Death | Yes No |
14% (N=14) 86% (N=86) |
22% (N=22) 78% (N=78) |
chi-square | 0,1976 |
| Time from diagnosis to treatment completion/death | N Mean (SD) Median (IQR) Range |
100 241,21 (43,13) 238,5 (212,75 - 273) 153 - 326 |
100 239,74 (44,15) 240,5 (203 - 277,25) 152 - 326 |
U Mann-Whitney | 0,8431 |
| Neutropenia | Yes No |
8% (N=8) 92% (N=92) |
20% (N=20) 80% (N=80) |
chi-square | 0,025 |
| Anemia | Yes No |
6% (N=6) 94% (N=94) |
18% (N=18) 82% (N=82) |
chi-square | 0,0167 |
Table 1. General Descriptive Characteristics
Generated using R version 4.1.3
The most common comorbid conditions were also considered, such as hypertension, diabetes, obesity, chronic obstructive pulmonary disease, atherosclerosis, coronary heart disease, gallbladder stones, kidney stones, and peptic ulcer.
Before commencing the study, patients underwent basic blood parameter tests. Adverse events were examined for their frequency of occurrence, including neutropenia, anemia, diarrhea, and rash.
For identical divisions, drug dosage characteristics were also performed for the group receiving Therapy 1. Significant differences in drug dosages were observed for the second drug when stratified by gender and age group.
Women were given lower drug dosages more often than men. In the age group above 65 years, the dosage of drug 2 was higher than in the group of individuals not more than 65 years old.

Figure 4. Box plot - Relationship of drug 1 dosage by gender
Generated using R version 4.1.3
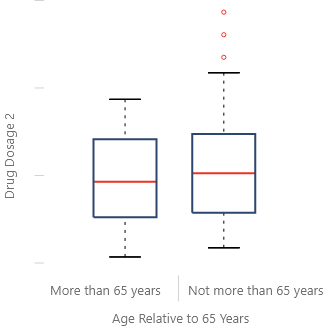
Figure 5. Box plot - Relationship of drug 1 dosage by age group
Generated using R version 4.1.3
Advanced Statistical Analysis
Depending on the type of study, in addition to basic statistical analyses, more advanced methods may be necessary. We perform survival analyses, logistic regression, moderation and mediation analysis, time series analysis, and prepare mixed models.
The impact of the type of therapy used in the study on patient survival was assessed by conducting survival analysis. Kaplan-Meier curves were used for this purpose, which show the probability of survival of a given percentage of individuals over time.
These plots are step functions, and confidence intervals around the curves were constructed based on the standard error and logarithmic transformation. For the study, the analysis was performed stratified by treatment arm and age relative to 65 years.
Figure 6. Survival Analysis by Age Using Kaplan-Meier Survival Function
Generated using R version 4.1.3
Treatment effectiveness was determined as the average difference in death rates relative to all individuals and subgroups stratified by treatment type. Death rates in subgroups were presented on forest plot-type charts, which calculate differences in death rates for two compared therapies along with their 95% confidence interval.
| Therapy 1 | Therapy 2 | Confidence interval | |
| Total | 14 % ( 14 / 100 ) | 22% (22/100) | -0.2 , 0.04 |
| Women | 16 % ( 8 / 50 ) | 24.56% (14/57) | -0.26 , 0.08 |
| Men | 12 % ( 6 / 50 ) | 13.95% (8/43) | -0.23 , 0.1 |
| Age > 65 years | 10.64 % ( 5 / 47 ) | 28.26% (13/46) | -0.35 , 0 |
| Age <= 65 lat | 16.98 % ( 9 / 53 ) | 16.98 % ( 9 / 53 ) | -0.14 , 0.15 |
| Former Smokers | 12.12 % ( 4 / 33 ) | 15.62% (5/32) | -0.23 , 0.16 |
| Non-Smokers | 6.67 % ( 2 / 30 ) | 16.22% (6/37) | -0.38 , 0.11 |
| Current Smokers | 21.62 % ( 8 / 37 ) | 35.48% (11/31) | -0.27 , 0.08 |
| Stage 1 | 4.17 % ( 1 / 24 ) | 3.7% (1/27) | -0.11 , 0.12 |
| Stage 2 | 4.35 % ( 1 / 23 ) | 8.33% (2/24) | -0.22 , 0.14 |
| Stage 3 | 16.67 % ( 4 / 24 ) | 29.17% (7/24) | -0.4 , 0.15 |
| Stage 4 | 27.59 % ( 8 / 29 ) | 48% (12/25) | -0.5 , 0.09 |
Generated using R version 4.1.3
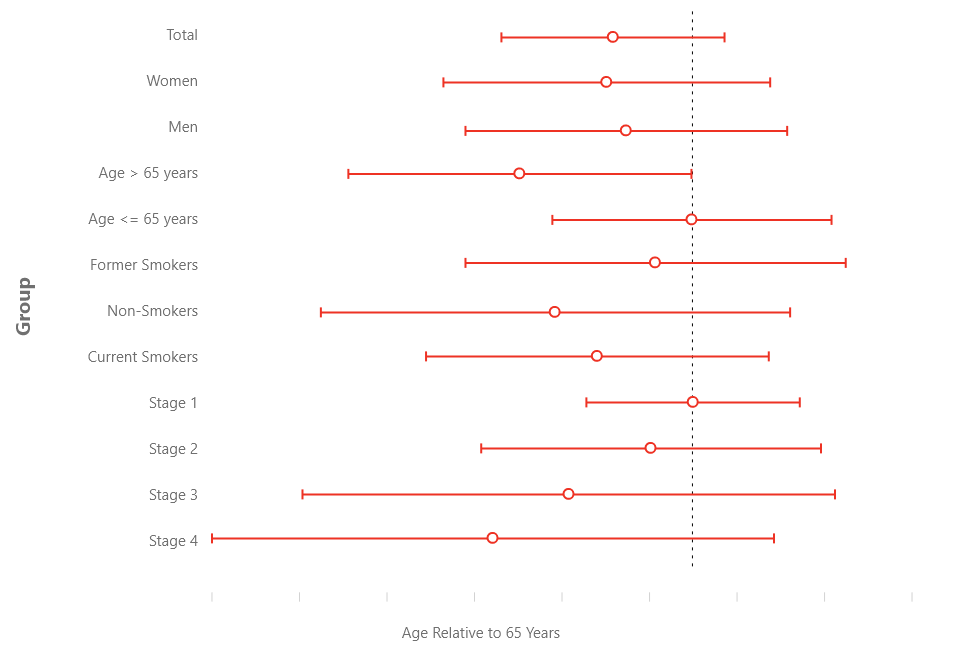
Figure 7. Effectiveness in Subgroups - Difference in Death Rates Relative to Therapy
Generated using R version 4.1.3
Summary
Contains a concise description of results relevant to the researcher, allowing for quick analysis.
The above statistical analysis comparing the effectiveness of two therapies did not show a clear advantage of Therapy 1, which included the administration of Drug 1 and Drug 2 in combination with chemotherapy, over Therapy 2, which is standard chemotherapy.
The general characteristics performed both overall and in subgroups showed certain differences in individual parameters, but they were not sufficient to draw conclusions about the significant superiority of one method over the other.
One of the few differences that could be noted was a lower incidence of adverse effects, especially neutropenia and anemia, in Therapy 1 compared to the use of only Therapy 2. Survival analysis by treatment type and efficacy analysis did not show that Therapy 1 was more effective and actually influencing the survival of patients.
For any questions, please feel free to contact us at
Medical Report
Socio-Economic Report